 version
1.0
version
1.0version
1.0
An aid to the identification of genomics islands, including pathogenicity islands, of potentially horizontally transferred genes
IslandPath: Help and Analyses
HELP
MAIN PAGE (click here to go to the current version)
This page acts as the starting point for the IslandPath application.
Available organisms are displayed in a table format together with pathogen
features (host range, primary disease, and life style), number of ORFs
and %G+C and dinucleotide information. By clicking on the IslandPath button,
an interactive graphical view of the genome (IslandPath Genome View) is
displayed.
ISLANDPATH GENOME VIEW
(click here
to see an example)
Overview:
This page shows a graphical representation of the selected organism's
genome. Features associated with genomic islands are represented by different
symbols on the graphic. The legend is listed below the graphic. The methods
used to determine these features are detailed below.
By clicking on the graph, users can select a region (of 100 ORFs) of interest
and the NCBI gene annotations for that region will be displayed below
the graph. Initially, the annotations for the first 100 ORFs are listed.
Users can change the %G+C cutoffs to reflect what they think are the appropriate
variance level for the organism. A default cutoff of +/- 3.48 is used
to reflect what we consider as a reasonable baseline, based on analysis
done with Chlamydia genomes (see below for more information).
Graphical Analysis:
Dots denote each protein-coding ORF, as predicted from the genome
project, and are shown in order on the chromosome, from left to right
in rows. These dots are coloured according to whether they have higher
%G+C than a given "high" cutoff (yellow), lower %G+C than a given "low"
cutoff (pink) or somewhere in-between (green). The default cutoffs are
"high" = mean %G+C for all ORFs, plus 3.48
"low" = mean %G+C for all ORFs, minus 3.48
These cutoffs (see below) can be adjusted and then the submit button pressed to reanalyze the data. For your convenience the mean of all ORFs, and the standard deviation of this mean, are provided.
mobility genes (currently, transposases and integrases) and tRNA genes are also marked on the graphical display, as these genes are commonly nearby or associated with horizontally transferred elements/pathogenicity islands which may be of interest for further study. tRNAs are known phage insertion sites, and may provide a recognition sequence for phages and other mobile elements that form islands. Other motifs associated with genomic islands and specifically pathogenicity islands will eventually be added.
By placing your cursor over a given dot, you can view the protein position number in the browser's status bar. This number corresponds to the "Pos" column in the annotation table below and can be a useful reference to quickly identify the genes of interest. A reminder that the dots correspond to protein coding sequences only, so the number of dots corresponds to the number of predicted proteins in the genome (according to the given genome project), not the number of genes (the latter includes RNA genes and in some cases pseudogenes). Gene number will therefore not correspond to the dot positions.
The table below the graphical display is described further below, however note that you can view a particular region of this table by clicking on a dot in the graphical display. Only the first 100 protein annotations are loaded in the table to allow fast loading. When clicking on any ORF, the annotation table for the 100 ORFs surrounding the selected ORF are then displayed.
Plain text tables of analysis, and tables of data within the graphical
display
Within each table there is a column that marks coding regions that are
plus or minus 1 or 2 standard deviations from the mean for all coding
regions (marked as -2, -1, +1, or +2, as appropriate). You may wish to
use this column to aid you in identifying regions containing coding regions
sharing deviant %G+C.
Within the tables of %G+C information, the column headings mean the following. Some columns may be empty depending on the particular genome project's analysis and on how recently the genome project has released the given sequence (which may affect column alignment with headings - we're working on this).
%G+C: As determined by the method below
SD: Standard deviation - if the gene %G+C is more than 1 S.D. from the mean it is marked appropriately
Location: Location in base pairs in the genome sequence
Strand: Orientation of the gene on the chromosome
Length: Length of encoded protein
PID: Protein ID number for the encoded protein, hyperlinked to the corresponding Genbank file
Gene: Gene name, according to the particular genome project
Synonym: Other names for this gene
Code: Function class (according to COG classification)
Product: Protein description, according to the genome project's annotation
Contrary to other tools that might be used in genomic island detection, IslandPath incorporates both DNA sequence signal features and annotation features to aid the identification of genome islands. We hypothesize that by overlapping multiple complementary features graphically, we can provide a fast and convenient tool for identification of potential genomic islands that may be subjected to further analysis.
DNA Sequence Signal (compositional bias)
Two types of DNA sequence signals are used to facilitate the detection
of regions that are likely to be genomic islands. These composition biases
have been used quite extensively in detecting genomic islands. It is worth
noting however that factors other than horizontal gene transfer, such
as gene expression level, can also affect the composition bias. As a result,
we have suggested a cut-off value for %G+C analysis (see below). Moreover,
additional in-depth analysis using comparative genomics and/or phylogenetic
techniques should be carried out to complement the IslandPath results,
where appropriate.
IslandPath uses a single ORF as basic units for calculating %G+C. This permits us to analyse potential gene-by-gene variance in proposed coding sequences. For %G+C calculation, users can set their own cut-off values for "high" or "low" G+C, with default cut-offs of +/-3.48% of the mean %G+C for all ORFs in the particular genome. This default reflects an analysis we performed of Chlamydia genome %G+C variance. Chlamydia genomes are noted for their apparent lack of HGT (Brinkman et al., 2002), so we hypothesized that gene %G+C variation in such a genome would be due to factors other than HGT (i.e. gene expression, etc.). This is important, as it is well known that other factors influence gene %G+C (Koski et al., 2001) and so we propose that %G+C variance that is above such Chlamydial variance is more likely meaningful. Moreover, we noticed that at this default cut-off, there are no abnormal %G+C clusters greater than 6 consecutive ORFs in the 5 completely sequenced Chlamydia genomes. Therefore, we suggest that gene-clusters greater than 6 ORFs are more likely
Our dinucleotide bias analysis method was adapted from formulas published by Samuel Karlin (for review see Karlin, 2001). The average absolute dinucleotide relative abundance difference ( Delta*(f,g)) derived from the following formula was calculated for each organism:
Delta*(f,g)=1/16 sum |p*xy(f)-p*xy(g)|
where f (fragment) was derived from sequences of six ORFs and their reverse
complements and g (genome) was derived from all predicted ORFs and their
reverse complements in the genome. The dinucleotide relative abundance,
p*XY, was calculated from the formula ( p*XY = f*XY/f*Xf*Y) where f*X
denotes the frequency of the mononucleotide X and f*XY the frequency of
the dinucleotide XY. First, the dinucleotide and mononucleotide counts
for each ORF were determined. Then nucleotide counts from six consecutive
ORFs were combined to calculate the p*XY(f) for each nucleotide pair (XY).
Since preferential selections on base-step stacking configurations by
organisms are thought to contribute partially to dinucleotide bias (Karlin
and Burge, 1995), we avoided creating "artificial, disjointed dinucleotides"
by not concatenating the ORF sequences before counting. For ORFs with
an odd number of bases, the last nucleotide or the first nucleotide was
ignored when counting in the forward or reverse orientation, respectively.
The sampling was done in an overlapping manner (shift by one ORF instead
of six ORFs at a time) and nucleotide counts for all ORFs were pooled
together to determine the genome dinucleotide relative abundance, p*XY(g).
Dinucleotide difference (Delta*(f,g) ) is then determined for each
cluster of ORFs. The mean (Delta*(f,g)) is calculated by averaging
the results from all ORFs in the genome, and regions with (Delta*(f,g))
greater than 1 standard deviation away from the mean are marked on the
IslandPath graphical display. The mean and standard deviation are multiplied
by 1000 and reported on the main page table to aid readability (avoiding
small decimal numbers). To minimize false positives, gene-clusters with
(Delta*(f,g)) > 2S.D. have all ORFs constituting the cluster
marked by strike lines; while regions with (Delta*(f,g)) > 1S.D.
have only the first 3 ORFs marked by strike lines. Therefore, regions
with only 3 to 5 consecutive ORFs marked by strike lines (derived from
less than 2 gene-clusters with dinucleotide bias greater than 1 S.D.)
should be interpreted with caution. We decided to use six ORFs as a cluster
because single ORF dinucleotide bias is too variable and previous codon
based analysis has shown that a minimum cluster of genes of approximately
4.5kb (corresponding to approximately 6-8 ORFs) is required for reliable
estimation of nucleotide composition (Lawrence and Ochman, 1997).
Annotation Features:
Certain types of genes are often found associated with genomic islands.
Two most well-known ones are "mobility genes" and structural
RNA genes (especially tRNAs and tmRNAs). It is believed that genomic islands
are derived from different kinds of mobile elements that have been fixed
in a population due to selective pressure or due to loss of the ability
to transfer. It is therefore not surprising that many mobility genes (transposases
and integrases) are found in genomic islands. There is evidence of tRNAs
being used as bacteriophage insertion recognition sites (Inouye et al.,
1991 and Williams, 2002), and many classical genomic islands (and pathogenicity
islands) are found to be bordered by tRNAs. We, therefore, decided to
look for these two types of features in the genomes we analysed.
Structural RNA (tRNAs and rRNAs) location are obtained from NCBI annotation. If the annotation is missing, tRNA information are predicted by tRNAscan-SE (Lowe and Eddy, 1997).
"Mobility genes" are determined by keyword searching the NCBI annotation. Genes that are annotated as transposases and integrases are compiled into lists and are marked on the graphic. We are currently incorporating Clusters of Orthologous Groups (COG) analysis (Tatusov et al., 1997) to facilitate the identification of mobility genes. Additional keywords may also be added to better reflect the use of certain keywords by some sequencing projects to annotate mobility genes.
Notable outliers in the analysis of %G+C variance:
We noted the following observations that seem may have biological consequences
for the %G+C variance observed.
No statistically significant correlation was observed between %G+C variance
and host range, whether the organism is a pathogen or not, its virulence,
tissue-specificity of the pathogen infection, its phylogeny, its mean
%G+C, the normality of its %G+C frequencies, and its genome size.
Examples of known islands
Some well-characterized virulence factors are known to be present in pathogenicity islands and other chromosomal encoded mobile elements. Some examples are listed below.
Pathogenicity Islands:
Uro/Entero-pathogenic E. coli type III secretion systems and effectors
(e.g. LEE island)
Salmonella typhimurium type III secretion systems and effectors (e.g.
SPI-1 and SPI-2)
Yersinia spp. (e.g. HPI for iron uptake)
Helicobacter pylori (CAG encodes a type IV secretion system)
Transposons:
ST enterotoxin genes in E. coli
Prophages:
Shiga-like toxins in EHEC
Diptheria toxin gene
Cholera toxin
Botulinum toxins
IslandPath analysis seems to be able to pick out many classical islands and reported prophages. Below we show a few graphics generated by IslandPath. The colored boxes are superimposed to show the regions that have been reported to be genomic islands or prophages.
Escherichia coli O157:H7 Sakai:
This genome is noted to contain many phage (number 1-18) or phage-like (number E1-E6) elements. These elements as published by the genome sequencing group are marked with red boxes in the graphic below. Note many of these elements do show dinucleotide bias and can be picked out by IslandPath. Moreover, many of these elements contain a large number of "hypothetical proteins" that may be worth further investigation. Since comparative genomics is not always possible with organisms whose close relatives have not been sequenced, it is very useful to be able to pick out these regions based on compositional bias.
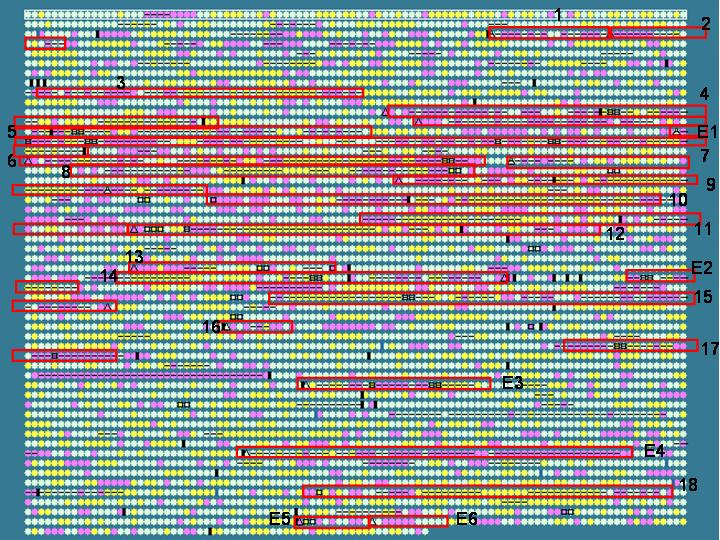
General information for these regions can be found here at the genome project site. Numbering correspoinds with the Sp# naming scheme used by the genome sequencing group.
Helicobacter pylori 26695:
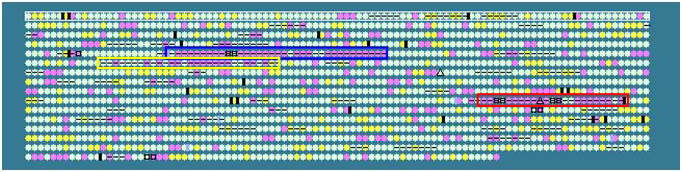
Yellow box: CAG pathogenicity island
Blue box: region contains virB homologues;
not present in H. pylori J99
Red box: plasticity zone (contain differnt
genes for J99 and 26695)
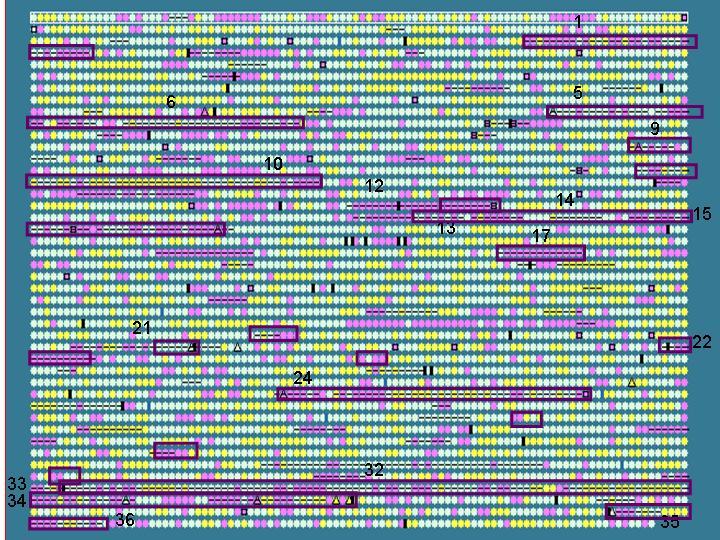
Salmonella typhi is used as an example to show that IslandPath is able to aid the identification of genomic islands and S. typhi unique regions (with respect to S. typhimurium).
First, putative islands are identified by using
an arbitrarily set criteria:
- at least 7 consecutive “ORFs” with dinucleotide bias
or
- at least 5 consecutive “ORFs” with dinuc. bias and one other
feature
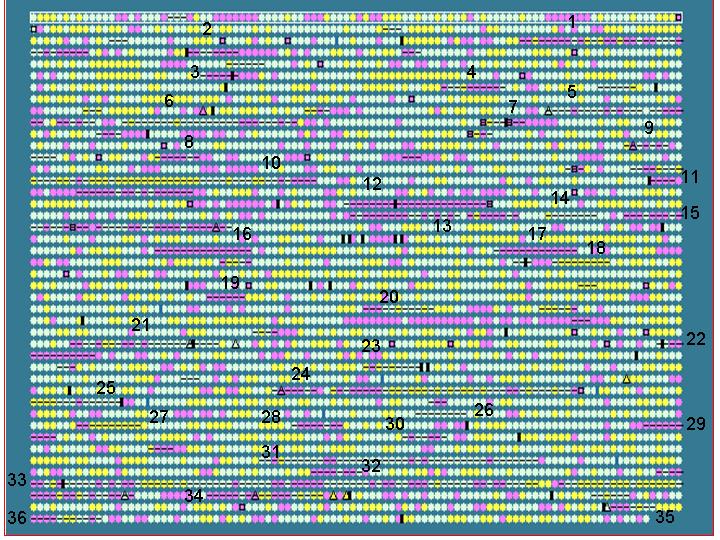
Results: 36 putative islands observed (left)
Note: criteria can be adjusted to include other features, such as %G+C bias.
To test if IslandPath can be used to identify known and proposed islands,
we compared regions identified by IslandPath for the S. typhi genome,
with S. typhi islands proposed in literature
blue boxes: Previously reported islands (SPI
1-5)
Orange boxes: putative islands proposed by
the genome sequencing paper
Red boxes: variable regions adjacent to tRNA
genes
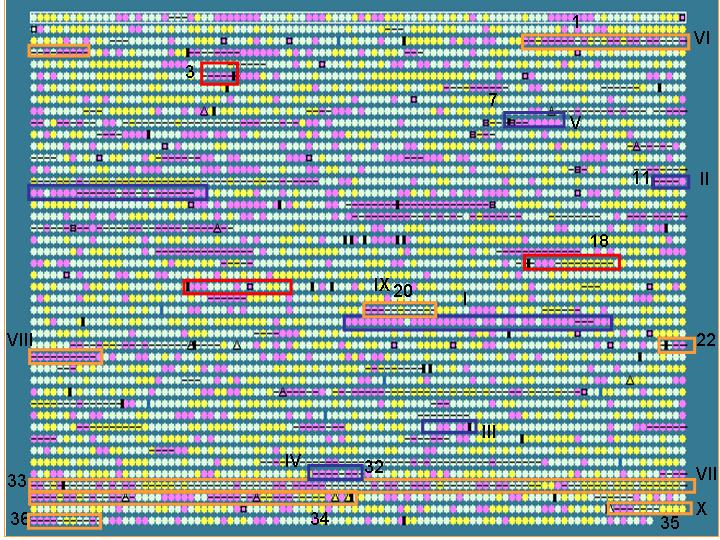
Results: 10/13 islands predicted based on the criteria set above
Unique gene clusters in a genome (compared to a closely related genome) may, in some* cases represent horizontally acquired sequences. We therefore compared the IslandPath results with known unique gene clusters in S. typhi (w.r.t. S. typhimurium)
Dark purple boxes: regions (>4 ORFs)
that are unique to S. typhi w.r.t. S. typhimurium - these
are putative recently horizontally acquired genetic elements.
Results: 12/17 of these unique gene clusters predicted; regions
that are not predicted tend to be small (< 5 ORFs); see also limitation
of this analysis below*
*It is worth-noting that without further comparative genomics
data, it is difficult to assess the selectivity (false positive rate)
of IslandPath since we don’t know if the unique regions are due to
insertions or deletions. By comparing multiple closely related genomes,
such issues would be easier to resolve. Note that the ribosomal superoperon
is one possible source of false-positive data
Brinkman, F.S., Blanchard, J.L., Cherkasov, A., Greberg, H., Av-Gay, Y., Brunham, R.C., Fernandez, R.C., Finlay, B.B., Otto, S.P., Ouellette, B.F., Keeling, P.J., Rose, A.M., Hancock, R.E., Jones, S.J. (2002) Evidence that plant-like genes in Chlamydia species reflect an ancestral relationship between Chlamydiaceae, Cyanobacteria, and the Chloroplast. Genome Res. 12:1159-67.
Inouye, S., Sunshine, M. G., Six, E. W., and Inouye, M. (1991) Retronphage phi R73: an E. coli phage that contains a retroelement and integrates into a tRNA gene. Science. 252(5008):969-71.
Karlin, S. and Burge, C. (1995) Dinucleotide relative abundance extremes: a genomic signature. Trends Genet. 11(7):283-90.
Karlin, S. (2001) Detecting anomalous gene clusters and pathogenicity islands in diverse bacterial genomes. Trends Microbiol. 9(7):335-43.
Koski, L. B., Morton, R. A., and Golding, G. B. (2001) Codon bias and base composition are poor indicators of horizontally transferred genes. Mol Biol Evol. 18(3):404-12.
Lawrence, J. G. and Ochman, H. (1997) Amelioration of bacterial genomes: rates of change and exchange. J Mol Evol. 44(4):383-97.
Lowe, T. M. and Eddy, S. R. (1997) tRNAscan-SE: a program for improved detection of transfer RNA genes in genomic sequence. Nucleic Acids Res. 25(5):955-64.
Tatusov, R.L., Koonin, E.V., and Lipman, D.J. (1997) A genomic perspective on protein families. Science. 278(5338):631-637.
Williams, K. P. (2002) Integration sites for genetic elements in prokaryotic tRNA and tmRNA genes: sublocation preference of integrase subfamilies. Nucleic Acids Res. 30(4):866-75.